


When you want to create or adjust the legend in matplotlib, things can get dirty. Legendkit may solve your headache.
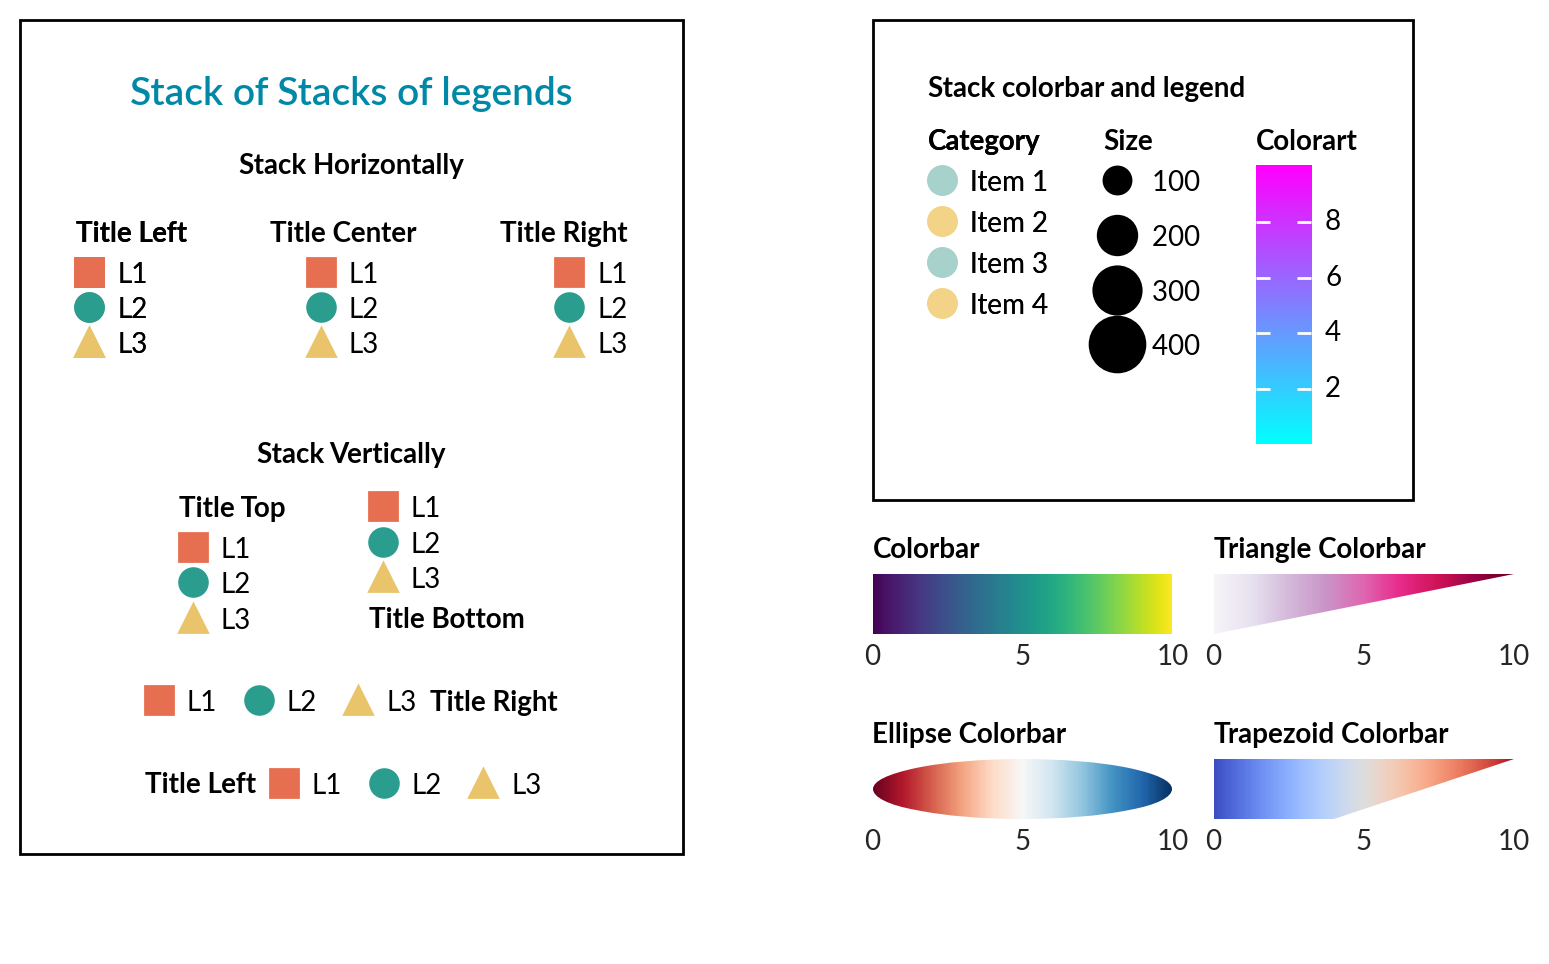
- Easy title placement and alignment
- Easy colorbar with shape
- Layout for multiple legends and colorbar*
pip install legendkitimport numpy as np
import matplotlib.pyplot as plt
from legendkit import cat_legend, colorbar, vstack
fig, ax = plt.subplots()
data = np.random.rand(10, 10)
mappable = ax.pcolormesh(data, cmap="RdBu")
# Categorical legend
leg = cat_legend(ax, colors=["#e63946", "#457b9d", "#2a9d8f"],
labels=["Group A", "Group B", "Group C"], title="Groups")
# Colorbar placed outside axes
colorbar(mappable, ax=ax, title="Value")
plt.show()