Universal CLI for multi-language codebase intelligence — analyze architecture, security, dependencies and git history across Go, Python, Rust, Java, Kotlin, Swift/Objective-C, TypeScript/JavaScript, C and C++, and produce one interactive HTML report, a Markdown document (LLM-ready), or a SARIF log.
cd archscope
go run ./cmd/archscope ~/code --open
~/code is any directory: a single app, a service repo, or a parent folder where several repositories are cloned side by side. Modules/services are auto-detected up to 3 levels deep, so services/<svc>/, src/<module>/ and monorepo layouts all work. --open launches the finished report in your browser. Use --format md for a Markdown report, --format sarif for SARIF 2.1.0, or --format both for HTML + SARIF together.
-
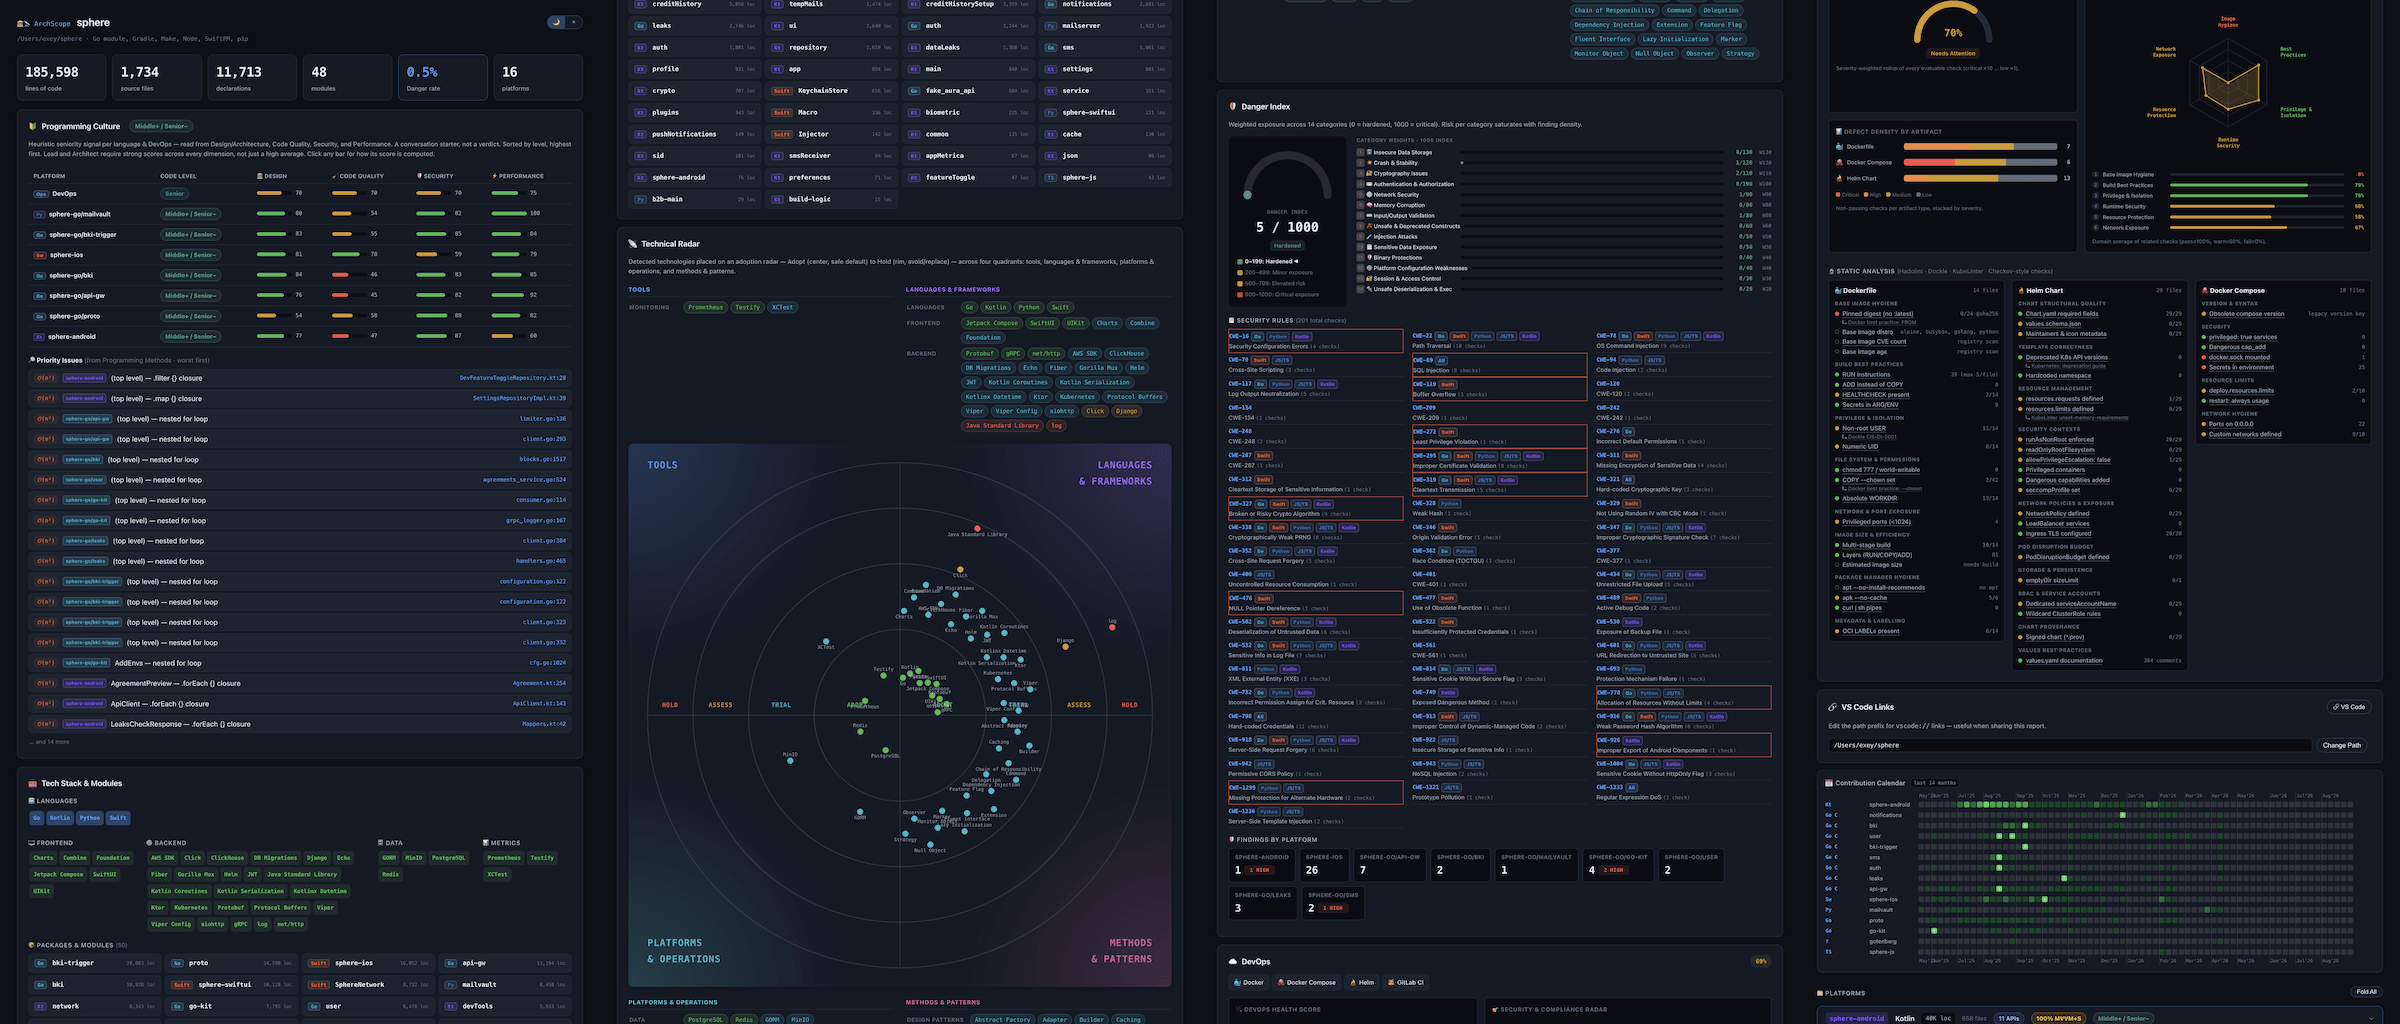
Summary bar — lines of code, source files, declarations, modules, Danger rate (0–100% scaled from the 1000-point index), and platform count. One tab per detected language.
-
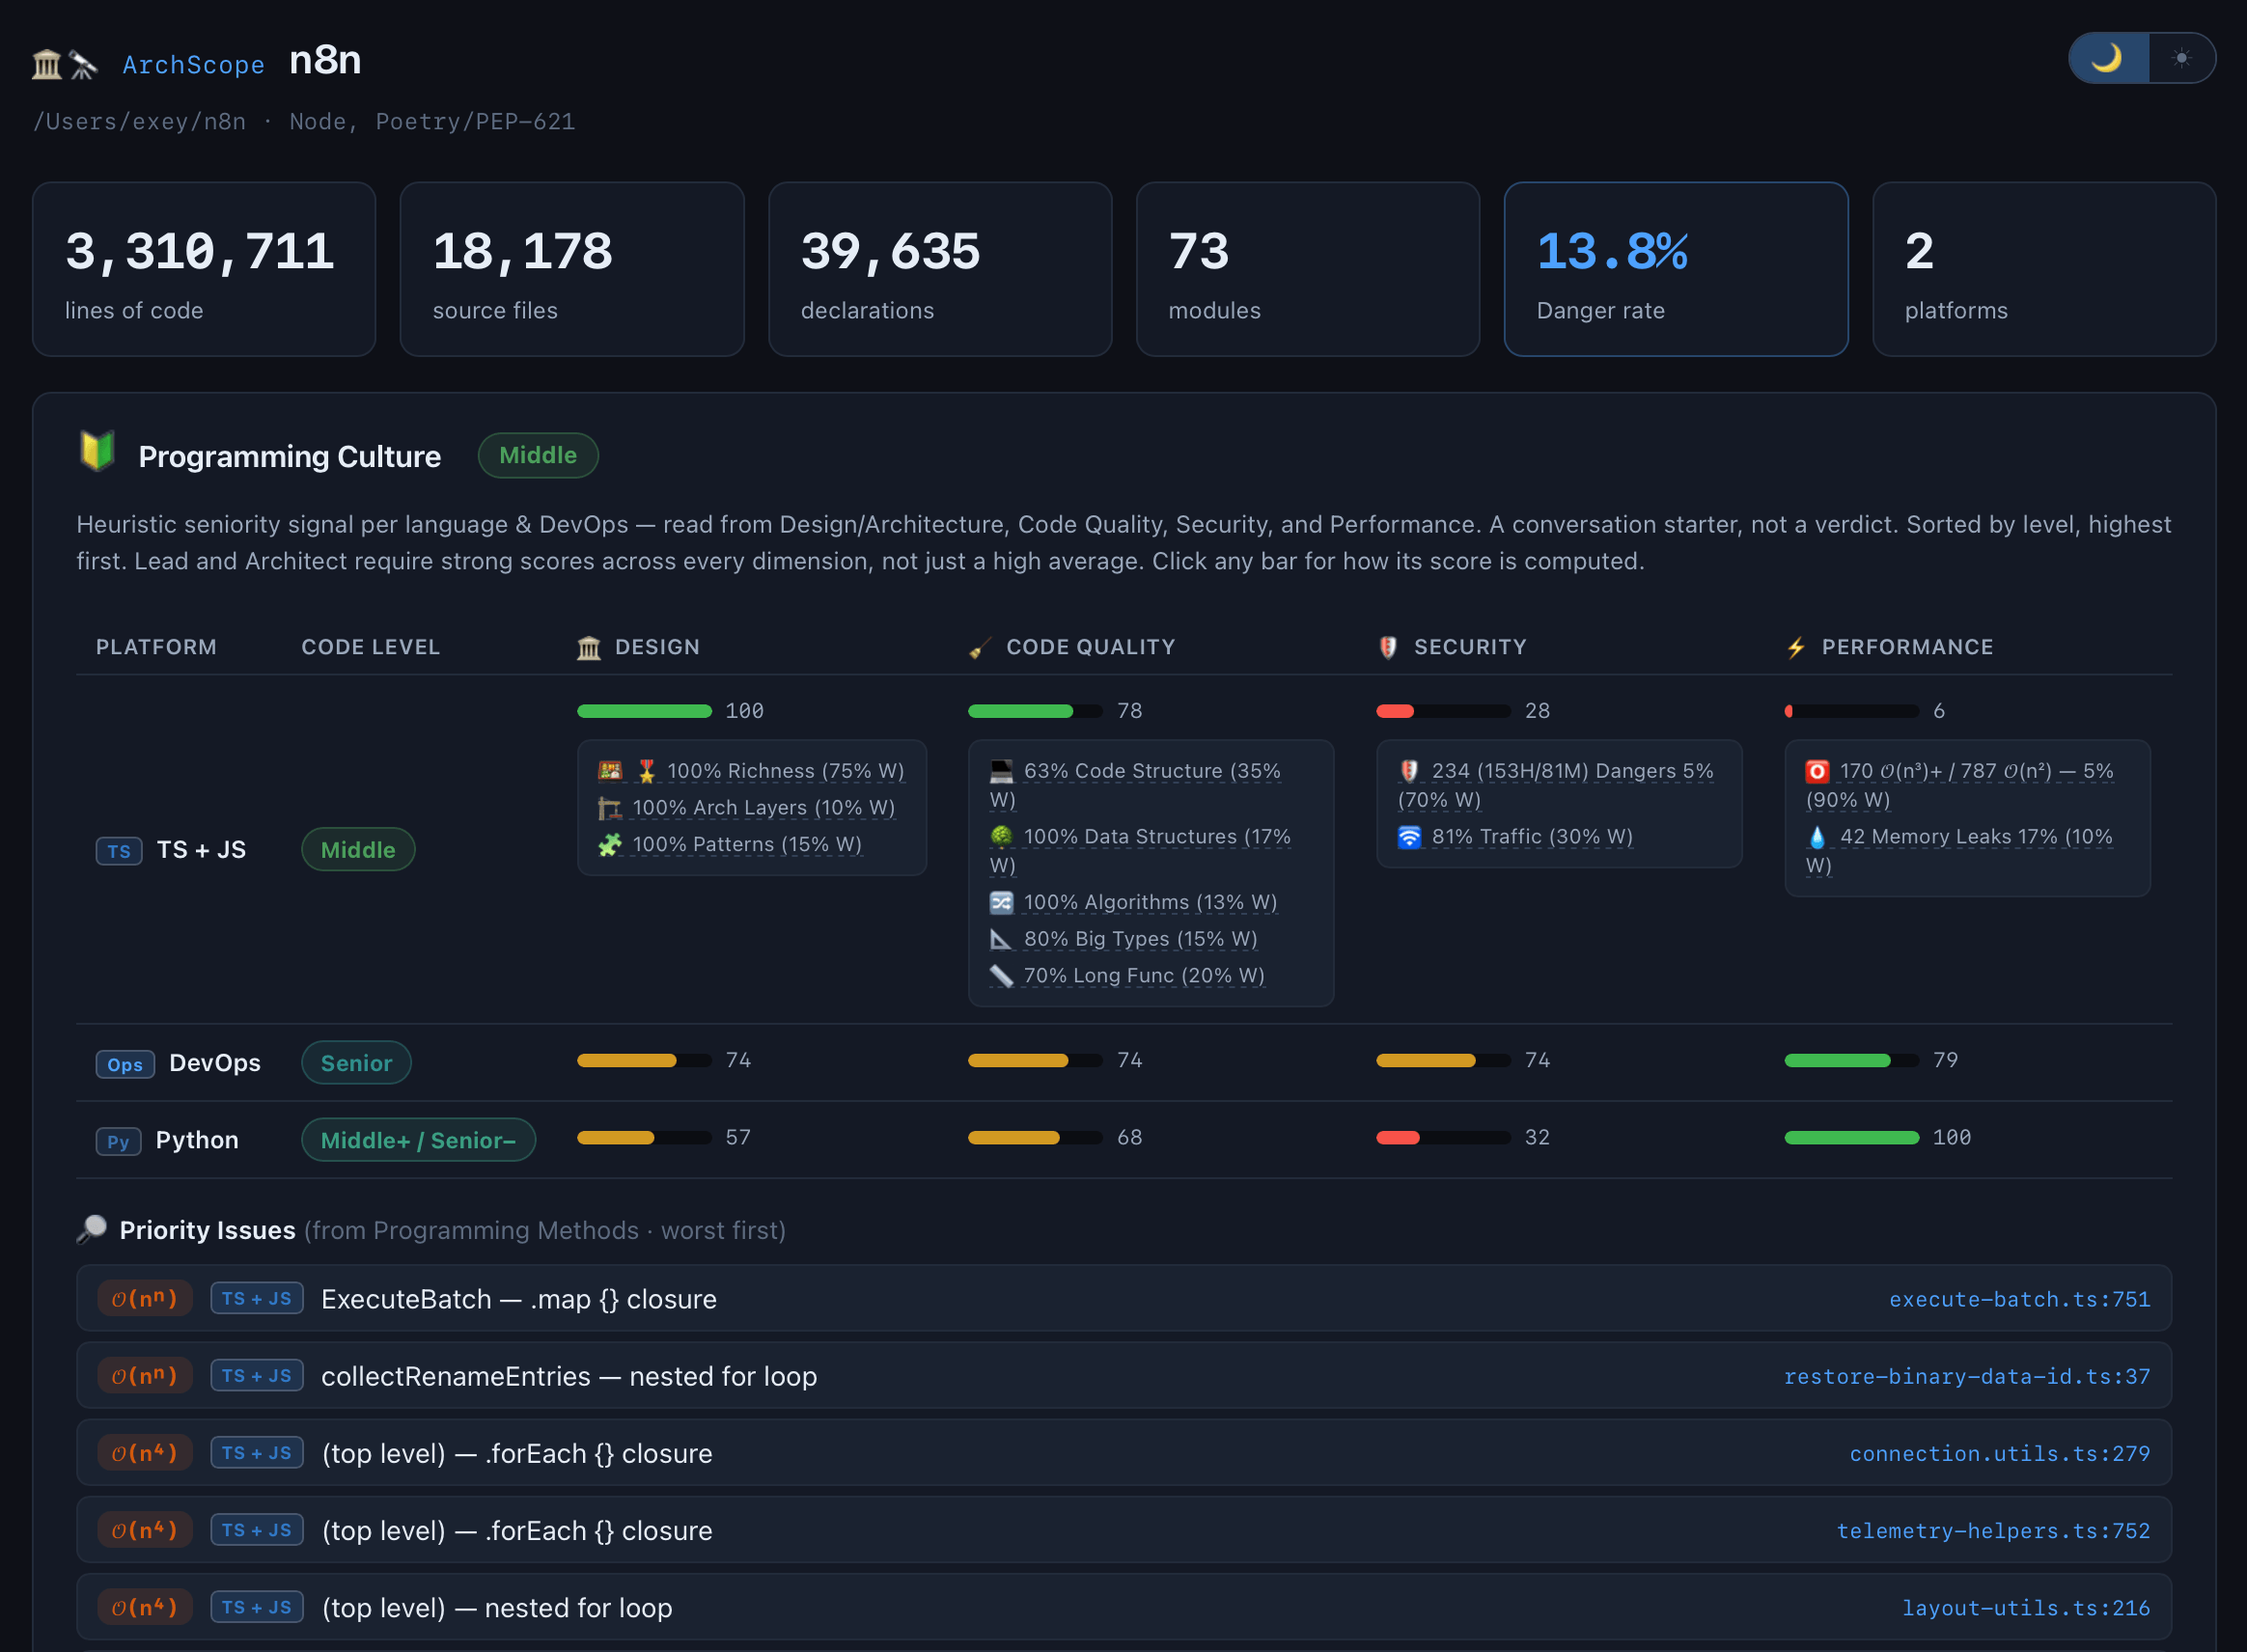
🔰 Programming Culture — a heuristic developer-seniority read per language platform (and DevOps), leading the report as the highest-level summary:
-
🧰 Tech Stack & Modules — repo-wide tag cloud: languages present + frameworks auto-detected from imports (SwiftUI, Combine, React, Next.js, Django, FastAPI, gRPC, GORM, …) and from config files (docker-compose, go.mod, Makefile). Below it: a package grid sized by LOC with per-language badges.
-
📡 Technical Radar — four cross-divided quadrants (Tools, Languages & Frameworks, Platforms & Operations, Methods & Patterns) with concentric Adopt → Trial → Assess → Hold rings. Every detected technology (plus GoF design patterns picked up repo-wide) is plotted as a labeled blip in its quadrant at its ring, with the same chips listed underneath grouped by quadrant for full legibility.
-
☁️ DevOps — detected CI/CD, container, and IaC tooling as chips, followed by three compliance charts: a Security & Compliance Radar (6-domain spider chart — Image Hygiene, Best Practices, Privilege & Isolation, Runtime Security, Resource Protection, Network Exposure), a Defect Density by Artifact stacked bar (non-passing checks per Dockerfile/Compose/Helm, by severity), and a severity-weighted DevOps Health Score gauge. Below the charts: a dependency-free static-analysis matrix (Hadolint / Dockle / KubeLinter / Checkov-style checks) for Dockerfiles, docker-compose files, and Helm charts, and a ☸️ Kubernetes sub-card — one small card per Pod/Deployment/StatefulSet/DaemonSet/Job/CronJob found in a
kubectl -o yamlcluster dump or plain manifest files, each showing aggregate container CPU/memory requests↔limits and a kube-linter-inspired pass/warn/fail lint summary (resource limits, security context, probes, image pinning, host access), followed by Cluster Resources stat cards — Networking & Exposure, Configuration & Storage, RBAC & Service Accounts, Autoscaling & Budgets, and Operators — summarizing Services/Ingresses/NetworkPolicies, ConfigMaps/PVCs/StorageClasses, ServiceAccounts/Roles/ClusterRoles (with a wildcard-rule count), HPAs/PDBs, and any Prometheus/Vault/gateway operator CRDs found in the same dump. See Kubernetes cluster linting for how to feed it a cluster dump. -
🛡️ Danger Index — weighted security score (0 = hardened → 100% = critical) across 14 categories, each with its own weight and a saturating violation-density curve. Risk band: Hardened / Minor exposure / Elevated risk / Critical exposure. Backed by 187+ security rules across all languages plus universal cross-language checks.
-
📅 Contribution Calendar — GitHub-style 14-month heat-map of commit activity. One row per git repository (sorted most-active first), with month labels and a colour scale from no-activity to high-activity. Anomalous weeks (unusually high or low relative to the author's own baseline) are flagged with a dot overlay. Hover any cell to see the exact date, commit count and anomaly note.
-
Per-platform tabs — one tab per language (auto-expands when only 1–2 platforms detected), each containing:
🏛️ Architecture — client languages (Swift/ObjC, Kotlin, TS/JS) get app-architecture pattern detection: MVC, MVVM (and variants), VIPER, VIP, RIBs, Clean, Redux, TCA, MVP, MV — scored by role conventions and weighted signals. Backend languages (Go, Python, Java) get a layered architecture view: API / Models / Services / Persistence / Auth / Config / CLI / Infra / Tests bars + detected component chips.
-
🍱 Domain Model (Go · Python · Kotlin · Java) — spectrum from Anemic Domain Model (DAO/DTO/Manager-heavy service layer) to Rich Domain Model (DDD tactical patterns). Scored across three weighted dimensions:
-
Rich Domain Types (40%) — Entities, Value Objects, Aggregates (×2) vs. DAO/DTO/Manager/BO/DO/PO. Detects both Java/Kotlin-style suffixes (
*Entity,*Repository) and Go/Python-style directory conventions (aggregate/,entity/,valueobject/). -
Tactical DDD Patterns (35%) — Repository, Domain Event, Domain Service, Specification, Use Case, Factory, Event Handler. 5 of 7 = full score.
-
Layer Separation (25%) — presence of
/domain/,/infrastructure/,/application/, hex-arch port/adapter paths vs. anemic/dao/structure. Supports Go monorepo layouts (/pkg/domain/,/internal/domain/). -
Verdict: Strong Rich Domain Model → Leaning DDD → Transitional → Leaning Anemic → Strong Anemic → No Domain Model Detected.
-
Gradient spectrum bar, per-category bars, metrics table with tooltips and found-type examples.
-
⚖️ OOP vs POP (Swift) — protocol-oriented vs. object-oriented signal across five categories (Type System, Abstraction, Composition, Behavior, Architecture), with a spectrum bar and per-category breakdown. Appears in place of Domain Model for Swift platforms.
-
-
🧱 Spec Coverage (Go · Python · Java · Kotlin · TypeScript) — measures code→spec coverage: what percentage of detected code routes have a matching entry in a spec file. Scans the project tree for OpenAPI / Swagger (YAML + JSON), gRPC (
.proto), and GraphQL (.graphql/.gql) specs and cross-references them against route handlers extracted from source. Main metric bar —code→specpercentage:(code routes with a spec entry) / (total code routes). -
🛜 Traffic (Go · Python · Java · Swift · Kotlin · TypeScript/JavaScript · C/C++) — detected inbound and outbound connection signals: HTTP/gRPC/WebSocket endpoints, listener ports, external service calls, and data formats (JSON, Protobuf, …), deduplicated by URI+protocol across every module/file that registers it (all locations linked, not just the first). Shown as two tables — 📥 Inbound and 📤 Outbound — with protocol, URI/pattern, data format, source file(s), and module. Each inbound route gets a Spec column (✅ / ❓) when spec files are found. A 🩺 Traffic Health score sits above the tables — RESTfulness, API versioning coverage, documentation coverage, protocol modernity, dependency health, and observability, whichever sub-scores apply to the platform — and feeds 30% of 🔰 Programming Culture's Security dimension when present.
-
💡 Module Insights — four sub-sections in a responsive grid:
- 🕸️ Dependency Hotspots — modules ranked by in-degree (how many others depend on them), with Lines & Decl. Backend tabs also include an inline SVG dependency graph (node radius ∝ dependents).
- 🔧 Microservices (Go) / 📦 Packages & Modules (other languages) — clickable module grid with file count and LOC.
- 🔗 Module Penetration — modules imported by the most other modules (highest shared-dependency risk).
- 📝 TODOs & FIXMEs — per-module TODO and FIXME counts, sorted by total.
- 📏 Longest Functions — top 20 non-test functions by line count, with module and VS Code link.
- 🧠 Programming Methods (all languages) — language-agnostic code-construct detectors (ported from ArchSwiftScope), rendered as subcards grouped right after Domain Model. Each classifies declarations against a known catalog and deep-links every hit to VS Code:
-
🔗🧬 Coupling & Cohesion (Coupling: all languages · Cohesion: Go · Swift · TypeScript/JavaScript · Python · C++ · Java · Rust) — package-level Coupling (afferent
Ca/efferentCe, InstabilityI = Ce/(Ca+Ce)) from the same import dependency graph 🕸️ Dependency Hotspots uses, plus class-level CBO and Cohesion (LCOM, Normalized LCOM,CAM) wherever a language has a field/method/call extractor — Go's is AST-based (stdlibgo/ast); the rest are regex/brace-depth or indentation heuristics (Rust's separately walksstructfields andimplblocks, since Rust methods live outside the struct body). Two health bars with a glossary and worst-offender tables (deep-linked to source) above them. Languages without an extractor (plain C — no member-function concept to bind fields and methods together) get Coupling only; Cohesion is reported as explicitly unsupported, never a fabricated score. -
🧩 Design Patterns (all languages) — GoF pattern detection from naming conventions: Factory, Singleton, Builder, Observer, Strategy, Decorator, Adapter, Facade, Command, and more — grouped by Creational / Structural / Behavioral / Concurrency category. Two additions on top of the classic GoF set:
- Feature Flag (all languages) — a runtime behavior-switch pattern, detected from name suffixes (
*FeatureFlag/*FeatureToggle/*FeatureGate) and from known flagging-SDK imports (LaunchDarkly, Split, Unleash, ConfigCat, Flagsmith, Statsig, GrowthBook, Optimizely, Firebase Remote Config). - Swift language-feature idioms, ported from ArchSwiftScope's DesignPatternDetector — constructs Swift built straight into the language, rendered as a distinct, muted "language idiom" row so they don't inflate the pattern count the way a deliberate Factory/Observer/Command choice does: Extension (adding behavior without subclassing), Monitor Object (
actor— compiler-enforced mutual exclusion), and Lazy Initialization (lazy var). Alongside them, GCD/OperationQueue concurrency idioms and other Swift-specific signals that are deliberate choices (not idioms): Read–Write Lock (DispatchQueue+.barrier), Double-Checked Locking (os_unfair_lock+ repeated nil-check), Thread Pool (OperationQueuewith boundedmaxConcurrentOperationCount), Fluent Interface (≥2-> Selfmethods per file), Multiton (static keyed-instance dictionaries), Dependency Injection (import Swinject), and Observer via Combine (@Published/ObservableObject/import Combine, folded into the same Observer count as the naming-convention signals).
- Feature Flag (all languages) — a runtime behavior-switch pattern, detected from name suffixes (
-
🌳 Data Structures (all languages) — developer-implemented data structures classified against a large known catalog by type-name conventions: linked lists, stacks, queues, trees (BST, AVL, red–black, B-tree, segment/Fenwick, spatial), heaps, tries, hash-based (bloom/cuckoo filters, HyperLogLog, consistent hashing), graphs (adjacency list/matrix, union-find, DAG), and specialized structures (LRU cache, bit sets, sparse matrix, rope). Grouped by category (each with an icon), with a count and VS Code links to every declaration. Standard-library collections (Array, Set, Dictionary, Map) are excluded, UI-framework look-alikes (SwiftUI
HStack/VStack) are rejected, and generic single-word names (Stack,Queue,Tree, …) are only accepted when the type's body carries the structure's vocabulary (push/pop,enqueue,heapify,adjacency, …) — so aTelemetryStackservice is never miscounted. Ported from ArchSwiftScope's construct detectors. -
🔀 Algorithms (all languages) — well-known algorithms classified against a known catalog from function/type-name conventions, grouped by functionality: Sorting (bubble, insertion, merge, quick, heap, counting, radix, …), Searching & Selection (binary, linear, interpolation, jump, quickselect), Graph · Shortest Path · Flow (Dijkstra, Bellman–Ford, Floyd–Warshall, A*, BFS/DFS, Kruskal/Prim, Tarjan, Ford–Fulkerson), String Matching (KMP, Rabin–Karp, Boyer–Moore, Aho–Corasick, Manacher, Levenshtein), and Numeric & Classic (Euclidean GCD, Sieve of Eratosthenes, Newton–Raphson, FFT, Karatsuba, Kadane, Huffman). Each with a count and VS Code links. Detection is token-based (
quickSort→[quick, sort]) so common-word names need their functionality token —bubbleChartis not Bubble Sort. Adapts the catalog-classification premise of algorithm-identification research (execution profiling, MOSS, tree/graph-kernel SVMs, CodeBERT) to a static, dependency-free name-signal approach. -
🅾️ Complexity (all brace languages) — heuristic Big-O "health" read from iteration nesting: a function whose deepest simultaneous loop nesting is N levels (nestedfor/while, nested higher-order closures like.map/.filter, or a linear collection op such as.sorted()/.contains(where:)used inside a loop) is charged O(Nⁿ), and anything O(N²) or worse is surfaced as a time hotspot; collections allocated inside a loop are flagged as space hotspots. Shows time/space health scores (share of loop-bearing functions that stay O(N) or better), a collection-usage summary, and each violation's Big-O badge, symbol, reason, and VS Code link. Indentation-only sources (Python) have no braces, so they contribute nothing rather than a false reading. Ported from ArchSwiftScope's ComplexityDetector. -
💧 Memory Leaks (Go · Python · Java · TypeScript/JavaScript · Rust · Swift/Objective-C · C/C++) — resource-lifecycle health read by pairing each language's acquire call (file/socket/DB handle, timer, thread, heap allocation, event listener, …) against its matching release call, flagging every acquire site once a file's acquire count outpaces its release count. A few shapes with no natural pairing — Rust's
mem::forget, Swift's retain-cycle-prone closures — flag every risky occurrence directly instead. Each finding carries a severity, plain-language advice, and a VS Code link; feeds 10% of 🔰 Programming Culture's Performance dimension. -
🪄 Magic Constants (all languages) — well-known algorithms identified by the fixed literal values baked into their implementation: hash primes/offsets (FNV-1/1a), checksum polynomials (CRC-16/32/32C/64), cryptographic initialization vectors (MD5/SHA-1/SHA-256, ChaCha/Salsa
"expand 32-byte k"), PRNG coefficients (Mersenne Twister, xorshift, SplitMix64), and non-cryptographic hashes (MurmurHash2/3, Fibonacci hashing). Grouped by family, each with a count and VS Code links to the enclosing function. Matched by numeric value, so0x01000193,0x1000193, and16_777_619all resolve to the same FNV prime; low-entropy values (0x1021,0x8005) count only when written in hex, so an ordinary decimal port or id is never misread. Ported from ArchSwiftScope's MagicConstantDetector.
- 🐙 Git Analysis (repo-wide):
- Branching model classifier — scores Gitflow / Trunk-Based / GitHub Flow / GitLab Flow / OneFlow with confidence % and detected signals.
- Top contributors — commits and files touched per author.
- File churn — most-modified files across history.
- Tags & commits — semver tag list, commit volume, conventional-commit hygiene.
- Branch inventory — all branches with stale detection.
-
🛡️ Danger Details — this platform's rule violations grouped by rule, showing severity, CWE, file location, code snippet, and blame author. File links are VS Code deep links (
vscode://) — click to jump to the exact line. -
📂 Modules & Microservices (opt-in via
--render-modules) — per-module deep-dive at the bottom of the report: project-type badge, declaration mix, and a full file inventory (lines, estimated tokens, declarations, decl chips) with VS Code deep links. Module chips in each platform tab link down here.
A single pass surfaces whole-repo signals that a manual review or an LLM skimming a diff doesn't have the context window to add up:
| Metric | Value |
|---|---|
| Setup time | zero config — point it at a folder, no .yml to write |
| Speed | ~10 seconds for a 100K-line codebase |
- SAST — 187+ security rules across 9 languages plus universal cross-language checks (secrets, SQL injection, weak crypto, …)
- Architecture Review — DDD↔Anemic spectrum, OOP↔POP, and app-architecture pattern detection (MVC/MVVM/VIPER/Clean/Redux/TCA/…) read from real naming and layering conventions
- Coupling & Cohesion — package-level Ca/Ce/Instability plus class-level CBO/LCOM/CAM, surfacing brittle high-fan-out modules and "does two unrelated things" classes that a diff-scoped review never adds up
- Data Structures — 100+ implementations classified by catalog (BST/AVL/trie/bloom filter/LRU cache/…), not just "this type has a
pushmethod" - Algorithms — sorting/searching/graph/string/numeric algorithms identified by name-token and magic-constant signals
- Complexity — Big-O health from actual iteration-nesting depth, surfacing O(N²)/O(N³) hotspots across a whole function, not one diff hunk
- Traffic Analysis — every inbound/outbound HTTP/gRPC/WebSocket connection extracted straight from source, scored by a 🩺 Traffic Health read (RESTfulness, versioning, protocol modernity, dependency health, …)
- Nesting & Signatures — worst nesting depth and high-parameter-count functions flagged repo-wide via 💻 Code Structure
- Tech Radar — every detected technology, framework, and design pattern plotted on an Adopt → Trial → Assess → Hold radar
- Memory Leaks — unclosed handles, unstopped timers, un-freed allocations, and retain cycles caught by pairing each language's acquire/release calls
- VS Code integration — every finding, hotspot, and function is a
vscode://deep link straight to the exact line
Each language is one self-registering file in internal/lang/. A LanguageSpec declares its extensions, detection markers, parse patterns, whether it is a Client (UI) language, and its module noun:
| Language | Security | UI scan |
|---|---|---|
| Go | ✅ language rules + universal | — |
| Python | ✅ language rules + universal | — |
| Java | ✅ language rules + universal | — |
| Rust | ✅ language rules + universal | — |
| C | ✅ language rules + universal | — |
| C++ | ✅ language rules + universal | — |
| TypeScript / JavaScript | ✅ language rules + universal | ✅ |
| Kotlin | ✅ language rules + universal | ✅ |
| Swift / Objective-C | ✅ language rules + universal | ✅ |
Adding a language (e.g. rust.go) needs no central edit — importing the package triggers its init(). The Client flag is what routes a tab to pattern detection vs. the layered backend view; the module noun/icon control how its modules are labeled.
C, C++, and Objective-C all share the .h extension. Since a LanguageSpec normally owns its extensions exclusively, .h is instead resolved per-file by content: each of the three specs registers a Sniff predicate (ObjC signals like @interface/#import, C++ signals like class/namespace/std::), and whichever one matches first wins — plain C is the fallback when neither matches. See langspec.Registry.ResolveShared and internal/lang/{c,cpp,objc}.go.
Most of it really is "drop a file in internal/lang/ and its init() self-registers" — no central dispatch table to edit. The checklist below is everything a new language still needs, drawn from adding C/C++ support:
- Add a
Platformconstant ininternal/langspec/spec.go(e.g.PlatformRust), then list it inPlatformOrder(tab order) and thePlatformTitleswitch. - Create
internal/lang/<lang>.gowith aninit()that callslangspec.Default.Register(langspec.LanguageSpec{...}), setting:ID,DisplayName,Platform,Extensions(no dots),ModuleIcon/ModuleLabel,Client(only for UI/client-side languages — see below),VersionProbes,ProjectTypes,Modules(marker files / container dirs),Patterns(import/type/func/doc-comment/TODO regexes +DeclKindMap), and optionallyParseHook.- If the language shares an extension with another (like
.hacross C/C++/ObjC), setSniff func(peekLines []string) bool— a content-signal predicate. At most one contender for a shared extension may leaveSniffnil; that one is the fallback. Seeinternal/lang/{c,cpp,objc}.goandlangspec.Registry.ResolveShared.
- If the language shares an extension with another (like
- Add security rules in a paired
internal/lang/<lang>_security.go: package-level regexes, avar <lang>Langs = []string{"<id>"}language-ID list, and aninit()registering each rule viasecurity.Default.RegisterRule(...). Build rules with the shared constructors ininternal/lang/security_helpers.go—reRule(id, name, category, severity, langs, pattern, desc, skip...)for a single-pattern line match,twoReRule(...)for a sink+source two-pattern match,credentialRule(id, langs, desc)for the standard hardcoded-credential check. List the new rule IDs on the spec'sSecurityRuleIDs. - Extend
security.IsTestPathininternal/security/helpers.gowith the language's test-file suffix conventions (e.g._test.c,_unittest.cc) so test code doesn't trip false-positive security findings — both 🛡️ Danger Details and 🛜 Traffic rely on it. - Wire up 🛜 Traffic (optional, backend languages only): add the language's ID to
Module.AppliesToininternal/modules/traffic/traffic.go, and createinternal/modules/traffic/detect_<lang>.gowithfunc Extract<Lang>Traffic(filePath string, lines []string) (inbound, outbound []Entry); call it from the spec'sParseHook, storing results inpf.Extra["trafficInbound"]/["trafficOutbound"]. - Wire up 🔗🧬 Coupling & Cohesion (optional, only for languages with member functions): create
internal/lang/<lang>_members.gowithfunc extract<Lang>Members(lines []string) []parser.TypeMembers— for a brace-delimited language, abraceMembersConfig(type/field/method-name regexes + keyword/builtin sets) fed into the sharedextractBraceMembershelper ininternal/lang/members_common.gois usually enough (seeswift_members.go/typescript_members.go/cpp_members.go/java_members.go); indentation-delimited or non-brace-scoped-method languages (Python, Rust) need a bespoke walker instead (seepython_members.go,rust_members.go). Call it from the spec'sParseHook, storing the result inpf.Extra["members"]; leave it unwired for languages with no member-function concept (plain C) rather than fabricating data. - Add short-label entries for the new platform in three places:
platformShortLabelininternal/scanner/scanner.go(used by--group-by=folder/gitrepotab names), andplatformBadges/shortLangLabelininternal/report/html/sections.go(report-wide badges and module-card pills). - Add a badge color — a
.as-plat-<platform>{background:...; color:...}CSS rule ininternal/report/theme.go, alongside the existing.as-plat-go/.as-plat-swift_objc/etc. - Extend
config.Default().ExcludePathsininternal/config/config.gowith the language's build-output directories (e.g. CMake'scmake-build-debug,cmake-build-release,CMakeFiles) so build artifacts aren't scanned as source. - Write
internal/lang/<lang>_security_test.go— packagelang_test, blank-import_ "github.com/exey/archscope/internal/lang"to trigger registration, then one_Fires/_Safepair per rule using the sharedjavaDetect(t, ruleID, lines) inthelper (ininternal/lang/java_security_test.godespite the name — it's a generic cross-language test helper).
The Client flag (step 2) is what routes a tab to app-architecture pattern detection (MVC/MVVM/…) instead of the layered backend view — set it only for UI/client-side languages (Swift, Objective-C, Kotlin, TypeScript/JavaScript).
# Analyze a local directory and open the report
go run ./cmd/archscope ~/code --open

# Write both HTML and SARIF to ./reports/
go run ./cmd/archscope ~/code --format both --output ./reports

# Write a Markdown report (no CSS/JS — ideal for wikis, CI artefacts, LLM input)
go run ./cmd/archscope ~/code --format md --output ./reports

# Monorepo: each top-level folder gets its own tab/section — the default
go run ./cmd/archscope ~/code --open

# Single-language monorepo (or just don't want the folder split): group every
# file of a language back into one platform tab
go run ./cmd/archscope ~/code --lang-platforms --open

# Analyze a remote repository (cloned to a temp dir; full history for git insights)
go run ./cmd/archscope https://github.com/owner/repo --open

# Pin a specific branch or tag when analyzing a remote repo
go run ./cmd/archscope https://github.com/owner/repo --ref main --open

# Build a binary
go build -o archscope ./cmd/archscope
./archscope ~/code --open| Flag | Meaning | Default |
|---|---|---|
--open |
open the HTML report in the browser when done | off |
--format |
html | sarif | md | both |
from config (html) |
--output, -o |
output directory | from config (output/) |
--config |
path to an .archscope.json override file |
.archscope.json |
--ref |
git branch/tag/sha to check out (remote URLs only) | default branch |
--depth |
shallow-clone depth (remote URLs only; 0 = full history) |
0 |
--lang-platforms |
group all files of a language into one platform tab (shorthand for --group-by=language) |
off |
--group-by |
how to group platform tabs: language | folder | gitrepo |
auto-detected (see below) |
--render-modules |
include the Modules & Microservices section (file inventory, declarations, its graph) per platform, plus the global Architecture Graph — omitted by default | off |
--scan-all-files |
also scan git-submodule (third-party/vendored) directories | off — submodules are skipped by default |
Outputs are written as <project-name>.html, <project-name>.md, and/or <project-name>.sarif inside the output directory.
ArchScope decides how to split platform tabs from how many .git repositories it finds under the scanned path — no flag needed for the common cases:
-
0 or 1 repo — this is one project, not a monorepo of independent services, even if it has several languages or subfolders (like ArchScope's own
cmd//internal/split). Tabs are grouped by language regardless of folder layout. -
2+ repos — genuinely ambiguous, so ArchScope asks interactively (when stdin is a terminal):
- By Languages — one tab per language, regardless of folder or repo (
--group-by=language) - By first-level folders — one tab per top-level folder (
--group-by=folder, the long-standing default) - By folders with
.git— one tab per detected git repository, however deep it's nested (--group-by=gitrepo)
In a non-interactive shell (CI, piped input) it skips the prompt and falls back to option 2.
- By Languages — one tab per language, regardless of folder or repo (
Pass --group-by (or its --lang-platforms shorthand for language) to skip the detection/prompt entirely and pick a mode up front — useful for scripted/CI runs. With --group-by=folder or gitrepo, short language labels are used in tab names: Go, Py, TS, Kt, Swift. Tabs for the same folder/repo are kept visually adjacent with a separator, and the Markdown report mirrors the split — each folder/repo+language combination becomes its own ## section. When language grouping puts every file of a language in one card regardless of folder, the card names up to 3 of the busiest top-level folders it draws from (e.g. Swift + ObjC (Telegram, TelegramUI, …)) so a huge monorepo card still hints at where its files live.
The default exclude list covers the standard vendor/node_modules/Pods/.build/DerivedData/Carthage/bower_components/… directories, plus conventionally-named non-product folders even in monorepos that don't use any package manager for them — third-party/ThirdParty (vendored external libraries), build-system/BuildSystem (build tooling, code generators), scripts/Scripts, and fastlane. On top of that static list, ArchScope reads .gitmodules at the scan root and skips every git submodule it finds too — the cleanest signal for "this directory is someone else's externally-owned repository checked out inside mine," regardless of what the submodule happens to be named (catches vendored code the name-based list above doesn't anticipate). Pass --scan-all-files to scan git submodules too (useful if you specifically want their code included); the static exclude list is still controllable the normal way, via excludePaths in .archscope.json.
Progress is printed per stage:
 → Scanning source tree…
 → Found 24 files across 5 platform(s), 4 module(s)
 → Parsing 24 files…
 → Building dependency graph…
 → Analyzing git history (4 repo(s))…
 → Running 96 security rules…
 → Attributing findings via git blame…
 → Running report modules…
HTML  → output/myproject.html
The ☁️ DevOps → ☸️ Kubernetes sub-card lints Kubernetes workloads it finds anywhere in the scanned directory — either plain manifest files (k8s/*.yaml, deploy/*.yaml, ...) or a full kubectl get ... -o yaml cluster dump. To lint a live cluster, drop a dump anywhere inside the path you're about to scan:
kubectl get $(kubectl api-resources --verbs=list -o name | tr '\n' ',' | sed 's/,$//') \
  --all-namespaces -o yaml > ~/code/full-cluster-dump.yaml

go run ./cmd/archscope ~/code --open
ArchScope finds the dump by content (a kind: List document or a plain object), not by filename, so it can be named anything and placed anywhere in the tree. Objects are deduplicated by kind/namespace/name across every dump file found in the tree, so it's safe to drop overlapping dumps (e.g. one file per resource kind and a catch-all full-cluster dump) in the same path without double-counting anything. Pods owned by a Deployment/StatefulSet/DaemonSet/Job are further deduplicated to their controller's pod template so each distinct workload gets exactly one card, and the biggest cluster dumps (hundreds of workloads) are capped to the ones needing the most attention.
Past the workload grid, a Cluster Resources section tallies everything else in the same dump: Services (flagging privileged <1024 ports) and Ingresses (TLS ratio) and NetworkPolicies (flagged if zero) under Networking & Exposure; ConfigMaps/PVCs/StorageClasses under Configuration & Storage; ServiceAccounts/Roles/RoleBindings/ClusterRoles/ClusterRoleBindings (flagging wildcard * rules) under RBAC & Service Accounts; HorizontalPodAutoscalers/PodDisruptionBudgets under Autoscaling & Budgets; and one row per Prometheus/Vault/gateway-operator CRD kind found, under Operators.
go run ./cmd/archscope ~/code --open     # 1) try it instantly
go build -o archscope ./cmd/archscope    # 2) build a binary
go install ./cmd/archscope # 3) install system-wide ($GOBIN)config.Default() is the baseline; config.Load overlays a user .archscope.json, so a partial file only changes the keys it sets (output format/dir, security thresholds and disabled rules, fetch depth, hotspot count).
ArchScope can emit a SARIF 2.1.0 log alongside (or instead of) the HTML report. SARIF is the standard format consumed by GitHub Code Scanning, GitLab SAST, VS Code's SARIF Viewer extension, and most security dashboards.
- name: Run ArchScope
  run: |
    go run ./cmd/archscope . --format both --output reports

- name: Upload SARIF to GitHub Code Scanning
  uses: github/codeql-action/upload-sarif@v3
  with:
    sarif_file: reports/${{ github.event.repository.name }}.sarif
  if: always()
Findings appear inline on pull requests under the Security → Code scanning tab.
archscope:
  stage: test
  script:
    - go run ./cmd/archscope . --format sarif --output gl-reports
  artifacts:
    reports:
      sast: gl-reports/*.sarif
    paths:
      - gl-reports/
when: always- Install the SARIF Viewer extension.
- Run
archscope . --format sarif. - Open
output/<project>.sarif— findings appear in the Problems panel with file links.
| Flag | Files written |
|---|---|
--format html |
<output>/<project>.html |
--format sarif |
<output>/<project>.sarif |
--format md |
<output>/<project>.md |
--format both |
<output>/<project>.html + <output>/<project>.sarif |
The SARIF log maps each security rule to a reportingDescriptor, each finding to a result with physicalLocation (file + line), and severity to SARIF levels (error = HIGH, warning = MEDIUM, note = LOW).
go test ./...                 # all tests
go vet ./...                  # vet
gofmt -l .                    # formatting (should print nothing)
go test ./internal/git/... # one packagecmd/archscope/main.go CLI entry point — flags, progress, --open, --format, remote URL support
internal/
config/ global config + user-override overlay
langspec/ LanguageSpec, Platform, Registry (Client / ModuleNoun helpers)
lang/ one file per language (+ *_security.go rule files)
parser/ universal model + line scanner + dispatch
scanner/ tree walk, module detection, platform bucketing
security/ engine, 14 categories, model, helpers
universal/ cross-language rules (secrets, private keys, SQLi)
graph/ module dependency graph + PageRank + edges
git/ history, blame, branching-model classifier
fetch/ remote git-URL resolution (clone + cleanup)
modules/ pluggable report modules
arch/ architecture: client pattern detection + backend layered view
constructs/ code-construct detectors — data structures, algorithms, complexity, magic constants, design patterns, memory leaks, code structure, language richness, coupling & cohesion (ported from ArchSwiftScope / ultimate_bug_scanner)
dddmodel/ DDD vs. Anemic Domain Model analyzer (Go · Python · Kotlin · Java)
oopvspop/ Swift-only OOP↔POP analyzer
speccoverage/ API spec coverage: OpenAPI · gRPC · GraphQL vs. code routes (Go · Python · Java · Kotlin · TypeScript)
traffic/ HTTP/gRPC/WebSocket route + connection detection, plus 🩺 Traffic Health scoring
result/ AnalysisResult aggregate + pipeline (Run / RunWithProgress)
report/ shared HTML theme
html/ HTML writer (tabs, panels, SVG dependency graph, git section)
sarif/ SARIF 2.1.0 writer
markdown/ Markdown writer (mirrors HTML content; no CSS/JS)
testdata/ go-sample · multi (5-language) · arch-sample (MVVM + patterns)
- Go 1.21+
giton PATH (optional; only for the git-analysis section and blame attribution)